The next major release of our VCL Subscription (v21.2) is just around the corner. Before the official release, we wanted to share some good news that you've probably already guessed from the post title. Yes, v21.2 will ship with an early access preview (EAP) of our new product, ExpressCharts. In this post, I shall highlight the main features and capabilities the product will include in this preview.
Of course, should you have any questions or feedback on our new product, please comment below or submit a support ticket via the DevExpress Support Center. We will be happy to follow-up.
The VCL ExpressCharts Early Access Preview is available for all customers with an active DevExpress VCL Subscription. It is not available in the VCL Subscription trial version.
DirectX, GDI+, and GDI Support
The ExpressCharts Suite fully supports DirectX, GDI+, and GDI rendering and allows you to apply skins and transparency effects to chart elements. Anti-aliasing is enabled in both DirectX and GDI+ render modes and will enhance the graphical elements of charts even more.
Performance
Although the ExpressCharts Suite is currently available as an Early Access Preview, it already includes a number of optimizations that distinguish it from competing VCL chart libraries. Initial rendering is one aspect of performance that we've been concentrating on, another being what happens — and how quickly it gets redisplayed — when a chart is resized. Without a doubt though, the fastest way to display charts is to render them by using DirectX.
As we get closer to the official release for ExpressCharts (the release date is set for June 2022), we’ll share specific benchmarks for a broad range of usage scenarios. And yes, our expectation is that ExpressCharts will outperform its competitors – in some cases by a wide margin (for instance, right now ExpressCharts renders a line chart with one million points in under two seconds with DirectX, and resizing it completes in about one tenth of a second).
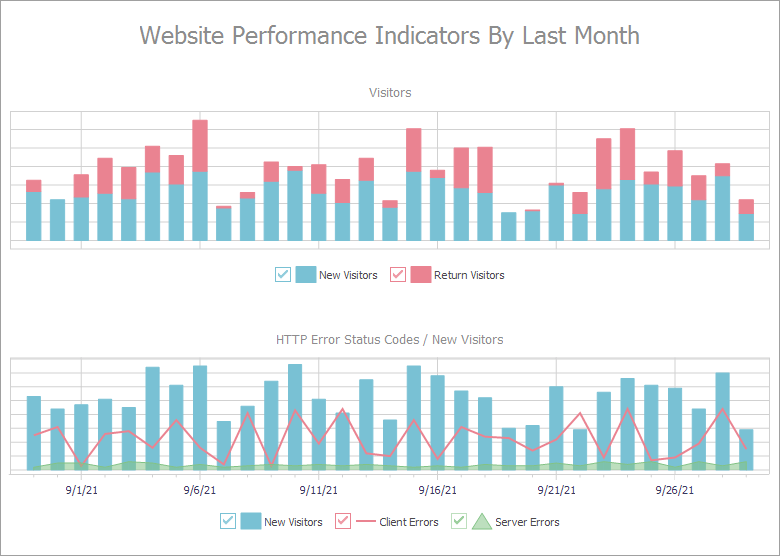
Multiple View/Series Types
The EAP version of the ExpressCharts Suite includes the following view/series types:
- Area, Stacked Area, and Full-Stacked Area
.png)
- Bar, Stacked Bar, and Full-Stacked Bar
.png)
- Line, Stacked Line, and Full-Stacked Line
.png)
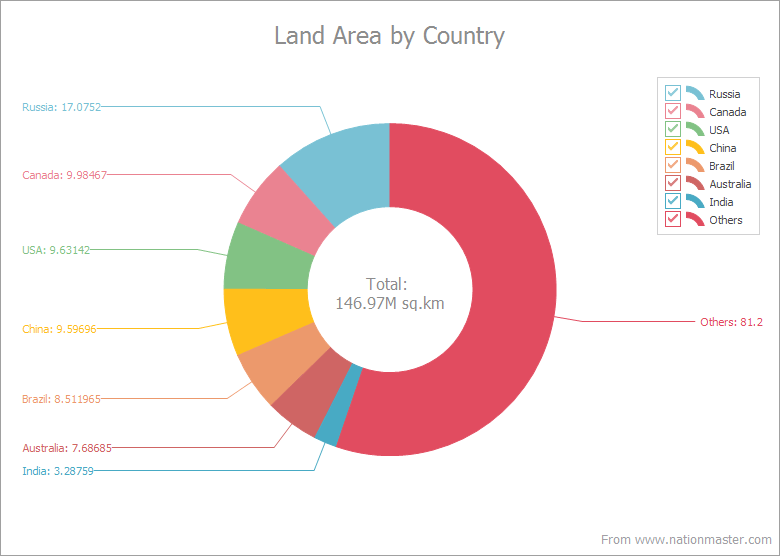
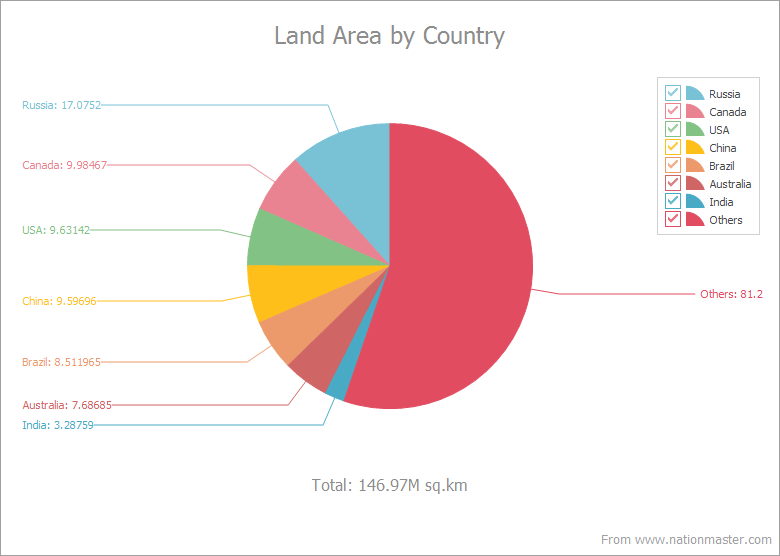
You and your users can change the applied chart type with a single option.
.png)
Flexible Design
You can create any number of diagrams and display any number of series/series points in each diagram.
Data Binding Modes
Each series has a DataBinding property that allows you to select the desired mode (Data-aware or Unbound) and specify the data binding options for your chart.
The code examples below show how to bind an Area series to data in these modes and plot it in a diagram.
Data-Aware
var
  ADiagram: TdxChartXYDiagram;
  ASeries: TdxChartXYSeries;
  ABinding: TdxChartSeriesDBDataBinding;
begin
  ADiagram := dxChartControl1.AddDiagram<TdxChartXYDiagram>;
  ASeries := ADiagram.AddSeries('Sales in 2020');
  ASeries.ViewType := 'Area';
  ASeries.DataBindingType := 'DB';
  ABinding := ASeries.DataBinding as TdxChartSeriesDBDataBinding;
  ABinding.DataSource := dsSales;
  ABinding.ArgumentField.FieldName := 'Region';
  ABinding.ValueField.FieldName := 'Sales';
end;
Unbound
const
  ACount = 5;
  ACountries: array[0..ACount - 1] of string =
    ('Asia', 'Australia', 'Europe', 'North America', 'South America');
  ASales: array[0..ACount - 1] of Double = (4.28, 2.27, 3.72, 4.18, 3.11);
var
  I: Integer;
  ADiagram: TdxChartXYDiagram;
  ASeries: TdxChartXYSeries;
  ABinding: TdxChartXYSeriesUnboundDataBinding;
begin
  ADiagram := dxChartControl1.AddDiagram<TdxChartXYDiagram>;
  ASeries := ADiagram.AddSeries('Sales in 2020');
  ASeries.BeginUpdate;
  try
    ASeries.ViewType := 'Area';
    ABinding := ASeries.DataBinding as TdxChartXYSeriesUnboundDataBinding;
    ABinding.ArgumentField.ValueType := 'String';
    for I := 0 to ACount - 1 do
      ASeries.Points.Add(ACountries[I], ASales[I]);
  finally
    ASeries.EndUpdate;
  end;
end;
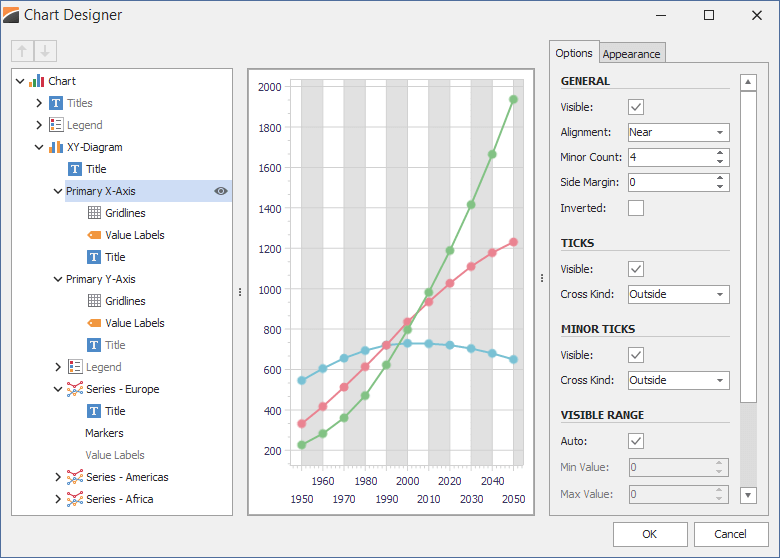
Customization Options
The VCL Chart Control provides an extensive API that allows you to customize chart content as needs dictate. The built-in Chart Designer (available at both design and runtime) helps you and your users preview and apply chart changes.
Free DevExpress Products - Get Your Copy Today
The following free DevExpress product offers remain available. Should you have any questions about the free offers below, please submit a ticket via the
DevExpress Support Center at your convenience. We'll be happy to follow-up.