jQuery Angular and React Diagram Control - OrgCharts with our JavaScript Widget
Step 1: Add an OrgChart to your webpage with the DevExpress Diagram widget.
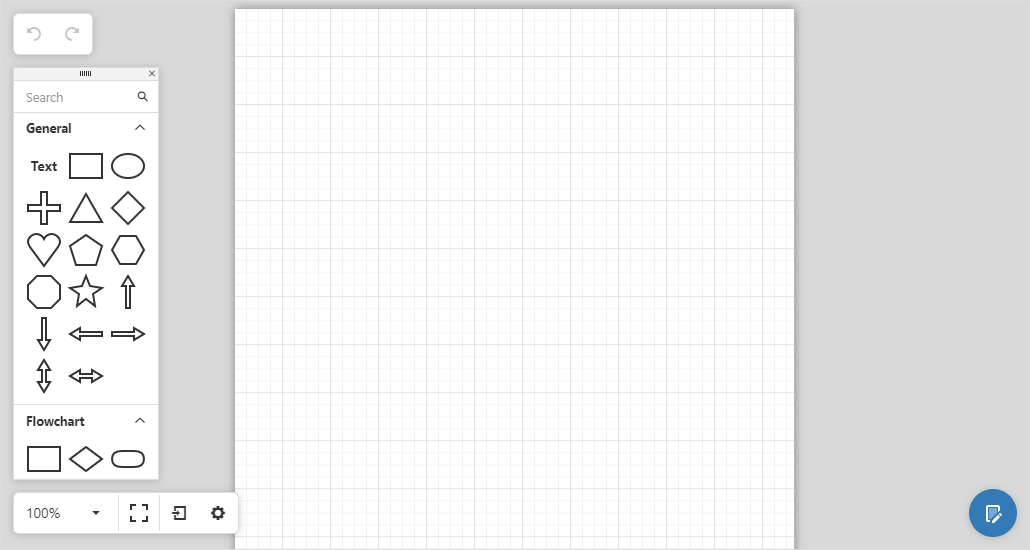
To get started, you'll need to add the DevExpress Diagram widget JavaScript and CSS files to a page (see Getting started with DevExpress Diagram). Next, add the OrgChart HTML container and initialize the widget:
Angular Diagram Code Example
<dx-diagram id="orgstruct"></dx-diagram>
                            import { DxDiagramModule, DxDiagramComponent } from 'devextreme-angular';

                            @NgModule({
                                imports: [
                                    DxDiagramModule
                                    ...
                                ]
                                ...
                            })
jQuery Diagram Code Example
<div id="orgstruct"></div>
$("#orgstruct").dxDiagram();
React Diagram Code Example
                            import { Diagram } from 'devextreme-react';

                            class App extends React.Component {
                                render() {
                                    return (
                                        <Diagram id={'orgstruct'} />
                                    );
                                }
                            }
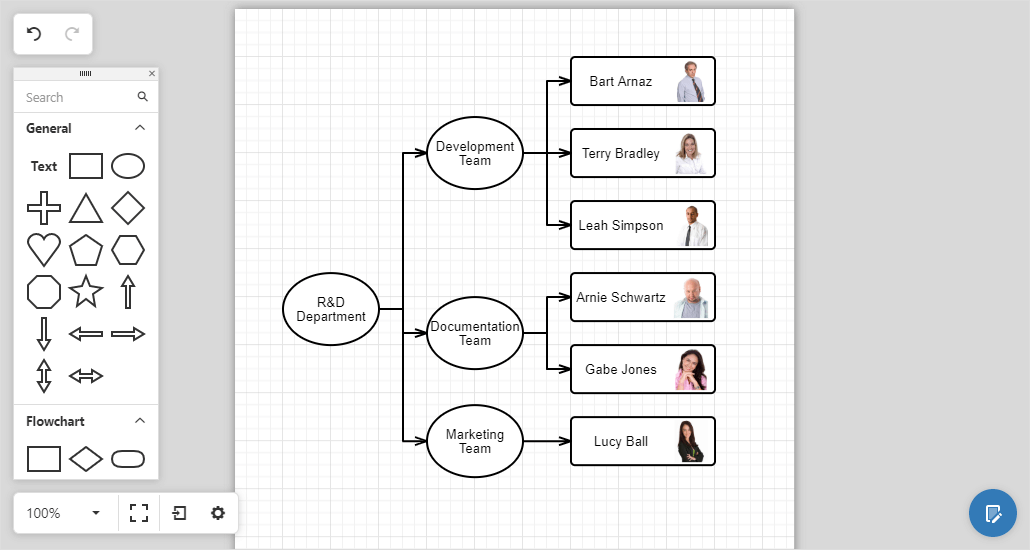
Step 2: Bind the OrgChart to a data source
To load an organization's chart data to the Diagram widget, assign your data source to the nodes.dataSource option. For a hierarchical data source, set the nodes.itemsExpr to the name of the field that contains nested items.
Angular Diagram Code Example
                            <dx-diagram id="orgstruct">
                                <dxo-nodes  [dataSource]="orgItems"
                                               keyExpr="id"
                                               textExpr="title"
                                               itemsExpr="items"
                                               imageUrlExpr="picture"
                                               [typeExpr]="itemTypeExpr">
                                    <dxo-auto-layout type="tree" orientation="horizontal"></dxo-auto-layout>
                                </dxo-nodes>
                            </dx-diagram>
                            import { Service } from './app.service';

                            export class AppComponent {
                                orgItems: any;
                                constructor(service: Service) {
                                    this.orgItems = service.getOrgItems();
                                }
                                itemTypeExpr(obj, value) {
                                    return obj.type === "group" ? "ellipse" : "cardWithImageOnRight";
                                }
                            }
jQuery Diagram Code Example
                            $("#orgstruct").dxDiagram({
                                nodes: {
                                    dataSource: orgItems,
                                    keyExpr: "id",
                                    textExpr: "title",
                                    itemsExpr: "items",
                                    imageUrlExpr: "picture",
                                    typeExpr: function(obj) {return obj.type === "group" ? "ellipse" : "cardWithImageOnRight";},
                                    autoLayout: {
                                        type: "tree",
                                        orientation: "horizontal"
                                    }
                                },
                            });
React Diagram Code Example
                            import Diagram, { Nodes, AutoLayout} from 'devextreme-react/diagram';

                            class App extends React.Component {
                                constructor(props) {
                                    super(props);
                                    this.orgItems = service.getOrgItems();
                                }

                                render() {
                                    return (
                                        <Diagram id="orgstruct">
                                            <Nodes dataSource={this.orgItemsDataSource}
                                                keyExpr="id"
                                                textExpr="title"
                                                imageUrlExpr="picture"
                                                itemsExpr="items"
                                                typeExpr={this.itemTypeExpr}>
                                                    <AutoLayout orientation="horizontal" type="tree" />
                                            </Nodes>
                                        </Diagram>
                                    );
                                }
                                itemTypeExpr(obj){return obj.type === 'group' ? 'ellipse' : 'cardWithImageOnRight';}
                            }
If your org chart data is stored in a linear array, set the nodes.keyExpr and nodes.parentKeyExpr options. To learn more, please review our Node List: Linear Array demo.
Refer to our Data Layer help topic to create two-way binding for diagram items.
Your JavaScript OrgChart (jQuery, Angular, Vue, React, MVC) is now ready for use.
The following sections describe how to customize our JavaScript Diagram further and introduce custom OrgChart behaviors to your web application.
Load OrgChart "entities" to a toolbox panel
This feature allows you to add entities to your diagram directly from the toolbox (just like regular shapes). Populate the customShapes option with data from the employee data source.
The toolbox.groups option lists shape groups that are visible in the toolbox.
Angular Diagram Code Example
                            <dx-diagram id="orgstruct">
                                <dxi-custom-shape *ngFor="let emp of employees"
                                    category = "employees"
                                    [type] = "employee" + emp.ID
                                    baseType = "cardWithImageOnRight"
                                    [defaultImage] = "emp.Picture"
                                    [defaultText] = "emp.Full_Name"
                                    [allowEditText] = "false"
                                    [textWidth] = "0.7">
                                </dxi-custom-shape>
                                <dxo-toolbox>
                                    <dxi-group category="general"></dxi-group>
                                    <dxi-group category="orgChart"></dxi-group>
                                    <dxi-group category="employees" title="Employees" displayMode="texts"></dxi-group>
                                </dxo-toolbox>
                            </dx-diagram>
                            import { Service } from './app.service';

                            export class AppComponent {
                                employees: any;
                                constructor(service: Service) {
                                    this.employees = service.getEmployees();
                                }
                            }
jQuery Diagram Code Example
                            $("#orgstruct").dxDiagram({
                                nodes: {...},
                                customShapes: employees.map(
                                    function(emp) {
                                        return {
                                            category: "employees",
                                            type: "employee" + emp.ID,
                                            baseType: "cardWithImageOnRight",
                                            defaultImageUrl: emp.Picture,
                                            defaultText: emp.Full_Name,
                                            allowEditText: false,
                                            textWidth: 0.7,
                                        }
                                    }
                                ),

                                toolbox: {
                                    groups: ["general", "orgChart", { category: "employees", title: "Employees", displayMode: "texts" }]
                                }
                            });
React Diagram Code Example
                            import Diagram, { CustomShape, Group, Toolbox } from 'devextreme-react/diagram';
                            import service from './data.js';

                            class App extends React.Component {
                                constructor(props) {
                                    super(props);
                                    this.employees = service.getEmployees();
                                }
                                render() {
                                    return (
                                        <Diagram id={'orgstruct'}>
                                            <Nodes>...</Nodes>
                                            {this.employees.map(function(employee, index) {
                                                return <CustomShape category={'employees'} type={`employee${employee.ID}`} baseType={'cardWithImageOnRight'}
                                                    defaultImage={employee.Picture} defaultText={employee.Full_Name} allowEditText={false}
                                                    textWidth={0.7} key={index} />;
                                                }
                                            )}
                                            <Toolbox>
                                                <Group category={'general'}/>
                                                <Group category={'orgChart'}/>
                                                <Group category={'employees'} title={'Employees'} displayMode={'texts'}/>
                                            </Toolbox>
                                        </Diagram>
                                    );
                                }
                            }
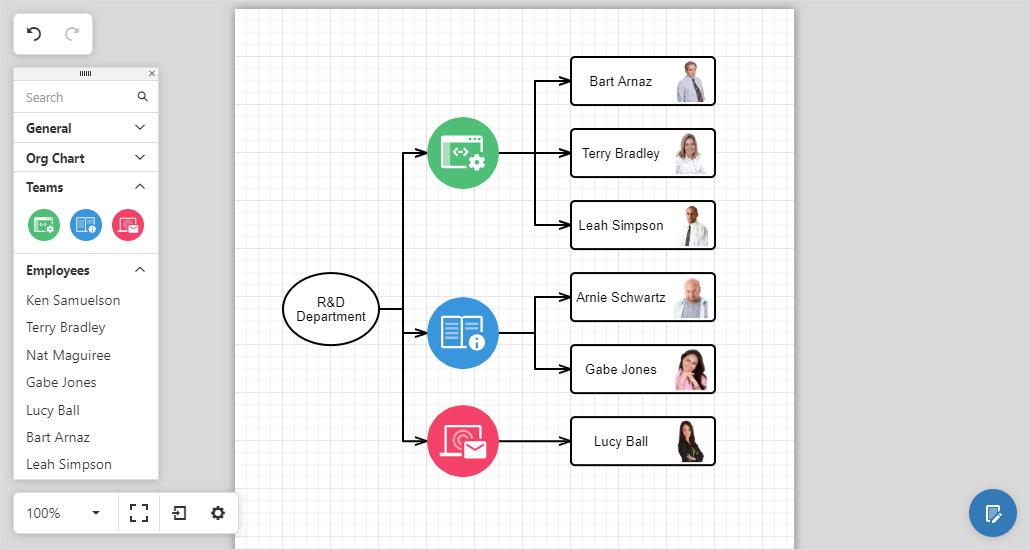
Add custom shapes to an OrgChart
Use the customShapes option to create custom shapes. Note that shape images must be supplied as SVG files.
Angular Diagram Code Example
                            <dx-diagram id="orgstruct">
                                <dxi-custom-shape
                                    category = "teams"
                                    type = "development"
                                    title = "Development Team"
                                    backgroundImageUrl = "images/shapes/dev.svg"
                                    [defaultWidth] = "0.75"
                                    [defaultHeight] = "0.75">
                                </dxi-custom-shape>
                                <dxi-custom-shape
                                    category = "teams"
                                    type = "documentation"
                                    title = "Documentation Team"
                                    backgroundImageUrl = "images/shapes/doc.svg"
                                    [defaultWidth] = "0.75"
                                    [defaultHeight] = "0.75">
                                </dxi-custom-shape>
                                <dxi-custom-shape
                                    category = "teams"
                                    type = "marketing"
                                    title = "Marketing Team"
                                    backgroundImageUrl = "images/shapes/mark.svg"
                                    [defaultWidth] = "0.75"
                                    [defaultHeight] = "0.75">
                                </dxi-custom-shape>
                                <dxo-toolbox>
                                    <dxi-group category="general"></dxi-group>
                                    <dxi-group category="orgChart"></dxi-group>
                                    <dxi-group category="teams" title="Teams"></dxi-group>
                                </dxo-toolbox>
                            </dx-diagram>
jQuery Diagram Code Example
                            $("#orgstruct").dxDiagram({
                                nodes: {...},
                                customShapes: employees.map(...).concat([
                                {
                                    category: "teams",
                                    type: "development",
                                    title: "Development Team",
                                    backgroundImageUrl: "images/shapes/dev.svg",
                                    defaultWidth: 0.75,
                                    defaultHeight: 0.75,
                                },
                                {
                                    category: "teams",
                                    type: "documetation",
                                    title: " Documentation Team ",
                                    backgroundImageUrl: "images/shapes/doc.svg",
                                    defaultWidth: 0.75,
                                    defaultHeight: 0.75,
                                },
                                {
                                    category: "teams",
                                    type: "marketing",
                                    title: "Marketing Team",
                                    backgroundImageUrl: "images/shapes/mark.svg",
                                    defaultWidth: 0.75,
                                    defaultHeight: 0.75,
                                }]),
                                toolbox: {
                                    groups: ["general", "orgChart", { category: "teams", title: "Teams" }, { category: "employees", title: "Employees", displayMode: "texts" }]
                                }
                            });
React Diagram Code Example
                            import Diagram, { CustomShape, Group, Toolbox } from 'devextreme-react/diagram';

                            class App extends React.Component {
                                render() {
                                    return (
                                        <Diagram id={'orgstruct'}>
                                            <CustomShape
                                                category = {'teams'}
                                                type = {'development'}
                                                title = {'Development Team'}
                                                backgroundImageUrl = {'images/shapes/dev.svg'}
                                                defaultWidth = {0.75}
                                                defaultHeight = {0.75}>
                                            </CustomShape>
                                            <CustomShape
                                                category = {'teams'}
                                                type = {'documentation'}
                                                title = {'Documentation Team'}
                                                backgroundImageUrl = {'images/shapes/doc.svg'}
                                                defaultWidth = {0.75}
                                                defaultHeight = {0.75}>
                                            </CustomShape>
                                            <CustomShape
                                                category = {'teams'}
                                                type = {'marketing'}
                                                title = {'Marketing Team'}
                                                backgroundImageUrl = {'images/shapes/mark.svg'}
                                                defaultWidth = {0.75}
                                                defaultHeight = {0.75}>
                                            </CustomShape>
                                            <Toolbox>
                                                <Group category={'general'} />
                                                <Group category={'orgChart'} />
                                                <Group category={'teams'} title={'Teams'} />
                                            </Toolbox>
                                        </Diagram>
                                    );
                                }
                            }
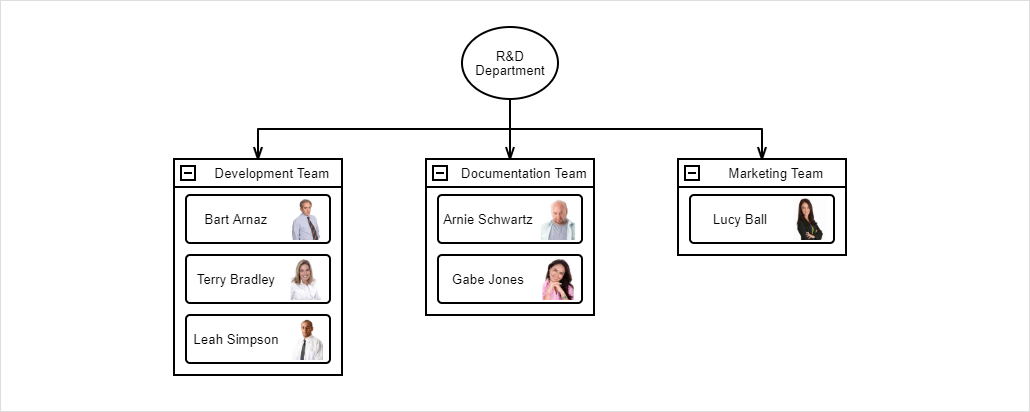
As you can see in the image below, custom shapes will be displayed within the toolbox panel's Teams tab.
Place Shapes into Containers
The Diagram widget allows you to wrap shapes into containers. Containers and content can be manipulated as needed.
Save and Load an OrgCharts's Layout
You can save diagram layouts, appearance options, and shape position data and load it on demand.
Angular Diagram Code Example
                            <dx-diagram #diagram="" id="orgstruct" (onOptionChanged)="onOptionChanged($event)" (onContentReady)="onContentReady()">
                                <dxo-nodes>...</dxo-nodes>
                            </dx-diagram>
                            export class AppComponent {

                                @ViewChild(DxDiagramComponent, { static: false }) diagram: DxDiagramComponent;

                                onOptionChanged(e) {
                                    if(e.name === "hasChanges" && e.value && autoSaveTimeout === -1) {
                                        autoSaveTimeout = setTimeout(function() {
                                              var data = e.component.export();
                                              window.localStorage.setItem("foo", data); // store data in some storage
                                              autoSaveTimeout = -1;
                                              e.component.option("hasChanges", false);
                                        }, autoSaveIntervalMs);
                                    }
                                }

                                onContentReady() {
                                    var diagram = this.diagram.instance;
                                    var foo = window.localStorage.getItem("foo"); // load layout data and apply it to the generated shapes
                                    if(foo)
                                        diagram.import(foo);
                                }

                                let autoSaveIntervalMs = 2000;
                                let autoSaveTimeout = -1;
                                ...
                            }
jQuery Diagram Code Example
                                var autoSaveIntervalMs = 2000;
                                var autoSaveTimeout = -1;
                                $("#orgstruct").dxDiagram({
                                    nodes: {...},
                                    onOptionChanged: function(e) {
                                        if(e.name === "hasChanges" && e.value && autoSaveTimeout === -1) {
                                            autoSaveTimeout = setTimeout(function() {
                                                  var data = e.component.export();
                                                  window.localStorage.setItem("foo", data); // store data in some storage
                                                  autoSaveTimeout = -1;
                                                  e.component.option("hasChanges", false);
                                            }, autoSaveIntervalMs);
                                        }
                                    },
                                    onContentReady: function(e) {
                                        var foo = window.localStorage.getItem("foo"); // load layout data and apply it to the generated shapes
                                        if(foo)
                                            e.component.import(foo, true);
                                    }
                                });
React Diagram Code Example
                            class App extends React.Component {
                                constructor(props) {
                                    super(props);
                                    this.diagramRef = React.createRef();
                                }

                                onOptionChanged(e) {
                                    if(e.name === "hasChanges" && e.value && autoSaveTimeout === -1) {
                                        autoSaveTimeout = setTimeout(function() {
                                              var data = e.component.export();
                                              window.localStorage.setItem("foo", data); // store data in some storage
                                              autoSaveTimeout = -1;
                                              e.component.option("hasChanges", false);
                                        }, autoSaveIntervalMs);
                                    }
                                }

                                componentDidMount() {
                                    var diagram = this.diagramRef.current.instance;
                                    var foo = window.localStorage.getItem("foo"); // load layout data and apply it to the generated shapes
                                    if(foo)
                                        diagram.import(foo);
                                }

                                render() {
                                    return (
                                      <Diagram id={'orgstruct'} ref={this.diagramRef} onOptionChanged={this.onOptionChanged.bind(this)}>
                                        <Nodes>...</Nodes>
                                      </Diagram>
                                    );
                                }
                                var autoSaveIntervalMs = 2000;
                                var autoSaveTimeout = -1;
                                ...
                            }
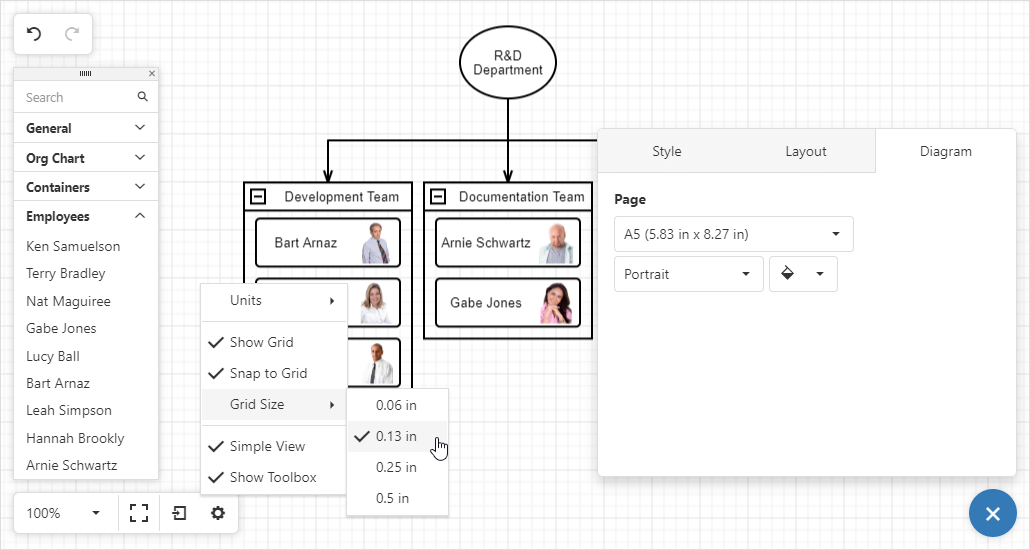
Configure Page Settings
To specify page settings, click the Properties button to invoke the widget's Properties panel. View toolbar commands control grid and scale settings.
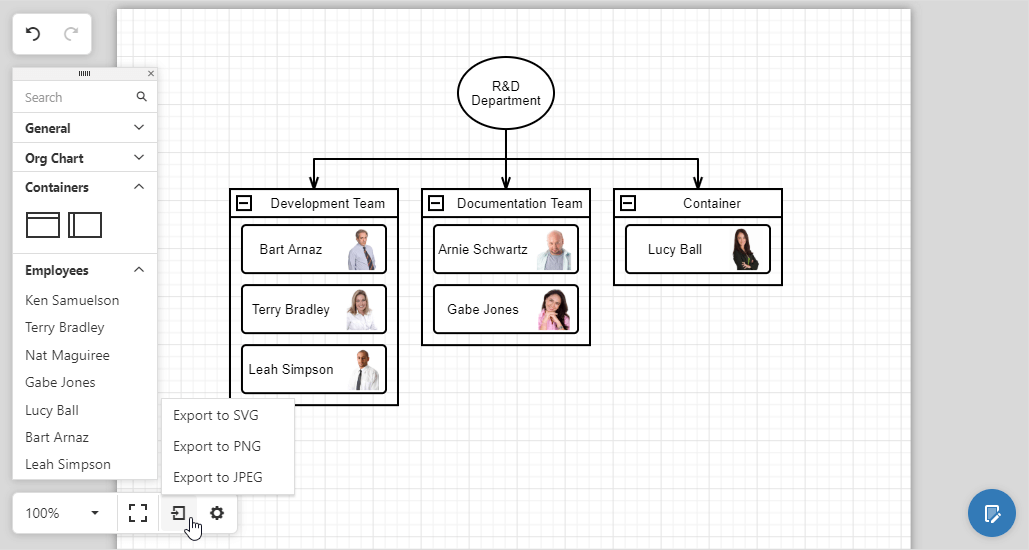
Export an OrgChart
You can export your OrgChart to the following file formats:
To begin your export, click the Export button and select the appropriate file format.
Read Only OrgChart
In read only mode, most of the UI elements are disabled. The View Toolbar remains available and allows users to change diagram view settings only (scale, grid size etc.) Use the viewToolbar option to hide the toolbar.
Angular Diagram Code Example
                            <dx-diagram id="orgstruct" [readOnly]="true">
                                <dxo-nodes>...</dxo-nodes>
                                <dxo-view-toolbar [visible]="false">
                                </dxo-view-toolbar>
                            </dx-diagram>
jQuery Diagram Code Example
                            $("#orgstruct").dxDiagram({
                                nodes: {...},
                                readOnly: true,
                                viewToolbar: {
                                    visible: false
                                },
                            });
React Diagram Code Example
                            import Diagram, { Nodes, AutoLayout, ViewToolbar} from 'devextreme-react/diagram';

                            class App extends React.Component {
                              constructor(props) {...}
                              render() {
                                return (
                                  <Diagram id={'orgstruct'} readOnly={true}>
                                    <Nodes>...</Nodes>
                                    <ViewToolbar visible={false} />
                                  </Diagram>
                                );
                              }
                            }
Questions?
Should you have any questions about the DevExpress JavaScript Diagram (with support for jQuery, Angular, Vue, React and MVC) or should you require implementation assistance, please submit a support ticket via the DevExpress Support Center. If you're new to DevExpress and want to evaluate our JavaScript controls, you can download a free 30-day trial below.